Skip to main content

Motor Vehicle Accident and Personal Injury Statistics in Tennessee and the U.S. 2025

Motor Vehicle Injury and Fatality Facts 2025: U.S. & Tennessee Snapshot
Traffic crashes remain a leading cause of injury and death across the U.S., with nearly 41,000 Americans killed and over 2 million injured annually. That’s one fatality every 12–13 minutes and an injury crash every 15 seconds. In addition to the human toll, these incidents cost society over $340 billion each year in medical costs, lost productivity, and legal expenses. In Tennessee—and especially urban centers like Memphis—these risks are compounded by high rates of DUI, speeding, and urban pedestrian exposure. This article breaks down the latest national and local data across causes, vulnerable groups, and economic impact to help understand the scale of the problem—and why experienced personal injury representation like that offered by John Michael Bailey Injury Lawyers is critical.
Research compiled for John Michael Bailey Injury Lawyers, Memphis
Key takeaways – traffic crash quick facts
- U.S. traffic deaths fell to 40,901 in 2023 (-4.3% vs. 2022), the second straight yearly decline; injuries were an estimated 2.44 million (+2.5%). (CrashStats)
- Early estimate for 2024: 39,345 fatalities nationwide, with the fatality rate dropping to 1.20 per 100M VMT (lowest since 2019). (NHTSA, CrashStats)
- Tennessee recorded 1,323 traffic fatalities in 2023 (virtually level with 2022). Pedestrian deaths totaled 188 and pedalcyclist deaths 12.
- Who is dying on U.S. roads (2023): passenger-vehicle occupants 23,959; 7,314 pedestrians; 6,335 motorcyclists; 1,166 pedalcyclists; 961 large-truck occupants. (CrashStats)
- Distracted driving: 3,275 deaths in 2023 (8% of all fatalities). (CrashStats)
- Alcohol-impaired driving: 12,429 deaths in 2023 nationwide (NHTSA). (NHTSA)
- When crashes turn deadly: 2023 U.S. nighttime fatalities were 22,114 vs. 18,495 in daytime. (CrashStats)
- Cost to society: U.S. motor-vehicle crashes cost $340 billion in a single year (2019), just over $1,000 per person. (AP News)
United States traffic fatalities – national picture
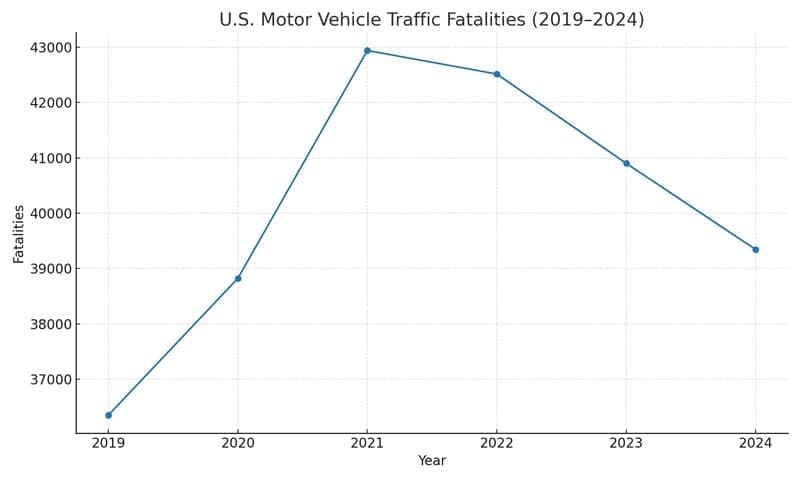
Trend, 2019–2024: After a pandemic-era spike, fatalities have edged down for two consecutive years.
- 2019: 36,355
- 2020: 38,824
- 2021: 42,939
- 2022: 42,514
- 2023: 40,901
- 2024 (early est.): 39,345
Sources: NHTSA Traffic Safety Facts and Research Notes. (CrashStats, NHTSA)
U.S. Motor Vehicle Traffic Fatalities Chart (2019–2024)
Who is most affected (2023)
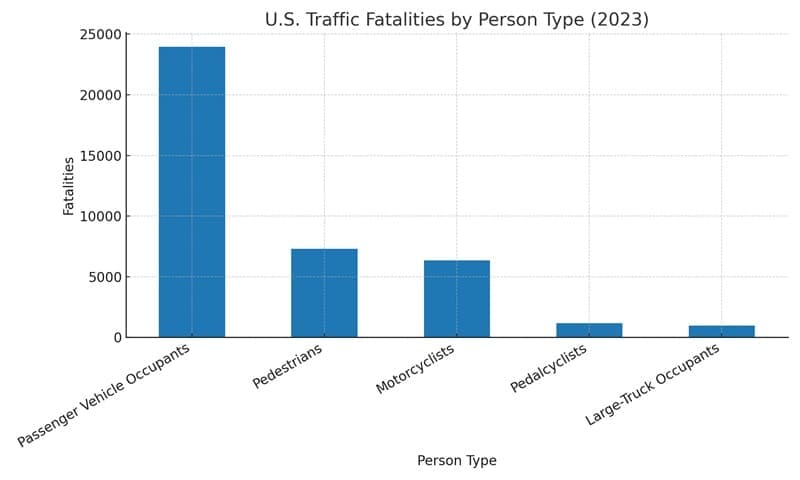
Passenger-vehicle occupants remain the largest share, but vulnerable road users (pedestrians and cyclists) account for ~20% of deaths combined.
- Passenger-vehicle occupants: 23,959 (-6.0% vs. 2022)
- Motorcyclists: 6,335 (+1.3%)
- Pedestrians: 7,314 (-3.7%)
- Pedalcyclists: 1,166 (+4.4%)
- Large-truck occupants: 961 (-12%)
Source: NHTSA 2023 Overview. (CrashStats)
U.S. Traffic Fatalities by Person Type (2023) chart:
Risk factors (selected 2023 indicators):
- Distraction: 3,275 fatalities; 8% of all traffic deaths. (CrashStats)
- Alcohol impairment: 12,429 fatalities nationwide. (NHTSA)
- Seat belts: U.S. front-seat belt use reached 91.9% in 2023 (record high), yet unrestrained deaths remain substantial and disproportionately affect young adults. (CrashStats, trafficsafetymarketing.gov)
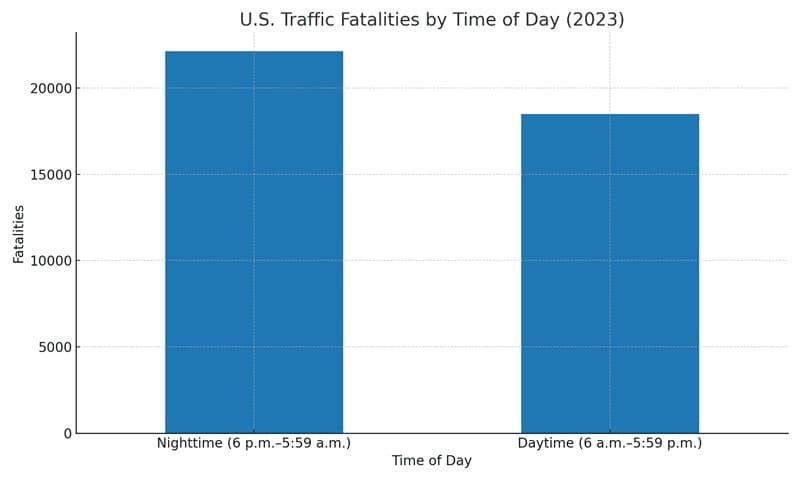
- When crashes are most deadly: Nighttime deaths (6 p.m.–5:59 a.m.) outnumber daytime by a wide margin: 22,114 vs. 18,495 in 2023. (CrashStats)
U.S. Traffic Fatalities by Time of Day 2023 chart:
Memphis, Tennessee traffic accidents snapshot
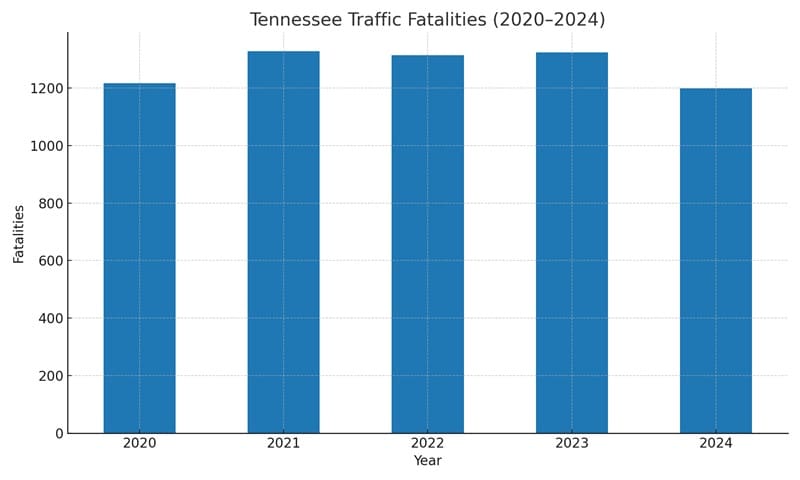
The latest Tennessee five-year summary confirms the state’s stubbornly high fatality levels since 2020.
Tennessee fatalities by year:
- 2020: 1,217
- 2021: 1,327
- 2022: 1,313
- 2023: 1,323
- 2024: 1,198
Source: Tennessee Traffic Fatalities: Five-Year Historical Report (TDOSHS).
Tennessee Traffic Fatalities (2020–2024) chart:
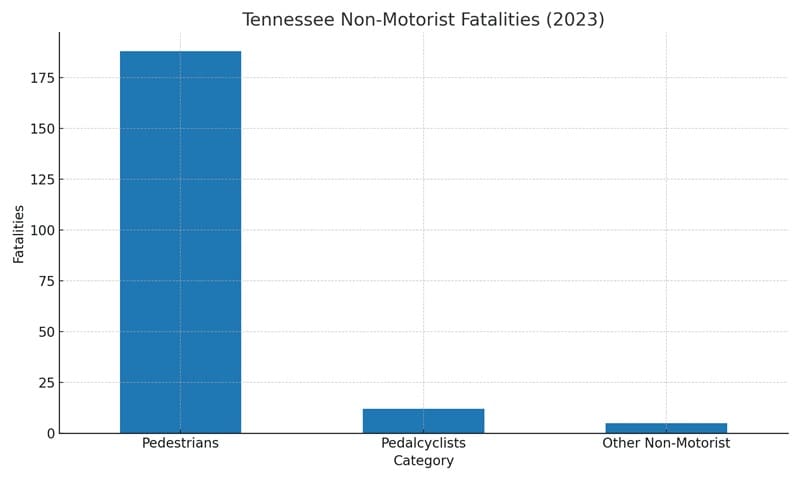
Non-motorist fatalities in Tennessee (2023):
- Pedestrians: 188
- Pedalcyclists: 12
- Other non-motorists: 5
Source: TDOSHS Five-Year Historical Report.
Tennessee Non-Motorist Fatalities (2023) chart:
Regional note (Memphis MPO area):
The Memphis Urban Area MPO’s 2023 Annual Safety Report highlights the Memphis region’s ongoing exposure for passenger-vehicle crashes and non-motorist risk, and provides county-level and jurisdiction-level breakdowns for regional planning. Journalists needing finer-grain Memphis/Shelby County numbers can cite this MPO report alongside the statewide TDOSHS tables. (memphismpo.org)
Additional traffic accident comparisons
- Urban vs. rural: In 2023, 58% of U.S. fatalities occurred in urban areas and 41% in rural areas (1% unknown), continuing the post-2016 shift toward urban exposure. (CrashStats)
- Weekends & nights: 2023 weekend fatalities declined to 17,262, while weekday fatalities dropped to 23,562; nights remain more dangerous than days. (CrashStats)
- Young drivers: Deaths among 15–20-year-olds increased 5.3% in 2023; the 25–34 group saw the largest decline. (CrashStats)
- Large trucks: Total people killed in crashes involving large trucks fell 8.3% in 2023. (CrashStats)
Methodology & sources
- National data: U.S. NHTSA Fatality Analysis Reporting System (FARS), final 2023 counts and Research Notes; 2024 numbers are NHTSA early estimates. (CrashStats, NHTSA)
- Tennessee: TDOSHS (Tennessee Department of Safety & Homeland Security) Five-Year Historical Report table (final annual totals, including non-motorists).
- Economics: NHTSA 2019 economic cost study (reported by AP for general readers). (AP News)
- Supplementary indicators: NHTSA topic pages and fact sheets for distraction, alcohol, seat-belt usage. (CrashStats, NHTSA)
Attribution tip for journalists:
“U.S. fatal crashes fell to 40,901 in 2023 (NHTSA, 2025), with 3,275 distraction-related deaths and 12,429 alcohol-impaired deaths. Tennessee recorded 1,323 fatalities in 2023 (TDOSHS Five-Year Historical Report).”
Conclusion: Why Personal Injury Statistics Matter — and Why You Should Talk to Us
At John Michael Bailey Injury Lawyers, we don’t just work inside the legal system — we study the data that shapes it. By tracking national and Tennessee crash statistics year-over-year, we understand not only how tragedies happen, but also how victims can secure justice and full compensation.
That commitment to evidence-based advocacy is why this report is trusted as a citable resource for journalists, researchers, and educators. Every statistic here is drawn from the most recent official sources, presented in a way that makes it easy to reference in news coverage, academic work, and public-policy discussions.
If you’re a member of the media or a university program, you have permission to link directly to this page in your reporting or research — please credit John Michael Bailey Injury Lawyers, Memphis.
If you or someone you love has been injured in a crash, the numbers tell one story, but your case tells another — and it deserves experienced, relentless legal representation. Contact us today for a free, no-obligation consultation and let our proven track record and data-driven approach work for you.